


Today, LoadStorm published a press release announcing our new Transaction Response Timing. For many professional performance testers, especially those used to products like HP Loadrunner or SOASTA CloudTest, wrapping timings around logical business processes and related transactions, is a familiar concept. For those of you that aren’t familiar, I’ll explain.
What is Transaction Response Time?
Transaction Response Time represents the time taken for the application to complete a defined transaction or business process.
Why is it important to measure Transaction Response Time?
The objective of a performance test is to ensure that the application is working optimally under load. However, the definition of “optimally” under load may vary with different systems.
By defining an initial acceptable response time, we can benchmark the application if it is performing as anticipated.
The importance of Transaction Response Time is that it gives the project team/application team an idea of how the application is performing in the measurement of time. With this information, they can relate to the users/customers on the expected time when processing request or understanding how their application performed.
What does Transaction Response Time encompass?
The Transaction Response Time encompasses the time taken for the request made to the web server, there after being processed by the Web Server and sent to the Application Server, which in most instances will make a request to the Database Server. All this will then be repeated again in reverse from the Database Server, Application Server, Web Server and back to the user. Take note that the time taken for the request or data in the network transmission is also factored in.
To simplify, the Transaction Response Time is comprised of the following:
Processing time on Web Server
Processing time on Application Server
Processing time on Database Server
Network latency between the servers, and the client
The following diagram illustrates Transaction Response Time.
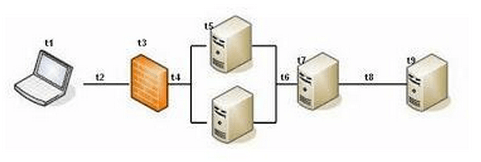
Transaction Response Time = (t1 + t2 + t3 + t4 + t5 + t6 + t7 + t8 + t9) X 2
Note: X 2 represents factoring of the time taken for the data to return to the client.
How do we measure?
Measurement of the Transaction Response Time begins when the defined transaction makes a request to the application. From here, until the transaction completes before proceeding with the next subsequent request (in terms of transaction), the time is been measured and will stop when the transaction completes.
How can we use Transaction Response Time to analyze performance issues?
Transaction Response Time allows us to identify abnormalities when performance issues surface. This will be represented as a slow response of the transaction, which differs significantly (or slightly) from the average of the Transaction Response Time. With this, we can correlate by using other measurements such as the number of virtual users that are accessing the application at that point in time and the system-related metrics (e.g. CPU Utilization) to identify the root cause.
With all the data that has been collected during the load test, we can correlate the measurements to find trends and bottlenecks between the response time, and the amount of load that was generated.
How is it beneficial to the Project Team?
Using Transaction Response Time, the Project Team can better relate to their users by using transactions as a form of language protocol that their users can comprehend. Users will know that transactions (or business processes) are performing at an acceptable level in terms of time.
Users may be unable to understand the meaning of CPU utilization or Memory usage and thus using the common language of time is ideal to convey performance-related issues.
It’s great that loadstorm has added the Trasaction timing features as well. It helps a lot while reporting a performance test result to the management who often have very limited visibility of the architectural/technical details of the application.